Analysis: Trends in SR&ED – Processing Times, Number of Claimants, Value
Reference Article (>5 Years Old)Please note that the information herein may be outdated, links could be inactive, and policies discussed may have evolved. For the most current data, consult our latest publications. If you would like us to refresh this article as it is of interest to you, please contact us. |

In this post, we summarize the important trends in SR&ED claim applications—with respect to processing times, number of claims, claimable expenditures, and tax credits—observed in the last two decades. We shed some light onto the evolution of the SR&ED claim process at the CRA and how the program got to where it is today.
Average Processing Time Attributable to CRA for Referred SR&ED Claims
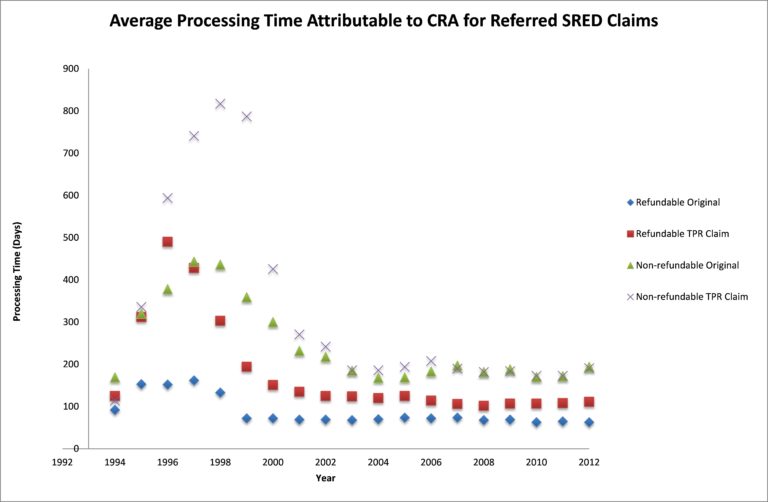
Why was the processing time so high prior to 1998?
The period from 1995 – 1998 is sometimes referred to as “the dark years.” The 18-month rule was introduced in September, 1994; this stated that the claimant has only 18 months after the end of a fiscal year to claim SR&ED for a project completed in that period. Prior to this, claimants were given a window of approximately eight months to submit their older claims.
The CRA received a flood of applications during the transitional period; however, they did not have enough resources to handle the large volume of claims received in 1994. Additionally, some of the claims dated back to the 1980s; it was difficult to locate the people who had actually worked on the projects. This led to very high application processing times at the CRA.
The years leading up to 2000 saw a number of changes introduced to the SR&ED program.
1992 – The proxy method—to calculate overhead expenses and administrative costs directly attributable to SR&ED—was introduced.
1993 – The tax credit available to small corporations was extended to CCPCs with taxable income between $200,000 and $400,000.
1994 – The special 30% tax credit rate applicable in the Atlantic and Gaspé regions was eliminated. The exemptions applying to sole-purpose SR&ED performers were eliminated. A time limit was set for identifying SR&ED expenditures incurred in previous years.
1995 – Changes were made with respect to information technology expenditures, contract research and non-arm’s length transactions, third-party payments, and unpaid amounts.
2000 – Provincial “super-deductions” were to be excluded from the calculation of eligible expenditures for federal SR&ED tax purposes.
The frequent changes to federal SR&ED tax incentives—some of which directly affected the application processing at the CRA—increased the complexity of the taxation system and created an environment of fiscal uncertainty for businesses planning to invest in SR&ED. At the same time, these changes made it difficult and time consuming for CRA reviewers to thoroughly review the claims.
Why did the processing time decrease and stabilize after 2000?
To address the high processing times, volume of complaints, and deteriorating relationship between the CRA and claimants, a minister’s conference (called “Building Partnerships”) was held in Vancouver in June 1998. The SR&ED industry discussed the program with the government in an attempt to make the program work effectively. In late 1998, a 13–point action plan based on the recommendations heard at the conference was released, which accounts for the decrease in processing time after that year.
Data Trends in Number of Claims for Refundable Original Claims

Sharp increase in number of claims from 1993–1994
As explained above, the introduction of the 18-month rule caused this sharp uptick in SR&ED claim submissions. Additionally, in 1993 the tax credit available to small corporations was extended to CCPCs with taxable income of between $200,000 and $400,000; this encouraged CCPCs that were not previously filing for SR&ED to claim SR&ED expenditures.
Decline in number of claims from 1994–2000
The frequent changes to federal SR&ED tax incentives in this period increased the complexity of the taxation system and created an environment of fiscal uncertainty for businesses planning to invest in SR&ED, which further discouraged them from filing claims.
Increase in number of claims after 2000
This period has focused on widening the reach and accessibility of the SR&ED tax system. The measures undertaken for this purpose were:
- Small business limit for a CCPC was increased to $400,000.
- Tax credit was extended to businesses with taxable income ranging from $300,000 to $500,000.
- Tax incentives were extended to SR&ED performed in Canada’s Exclusive Economic Zone.
- The $2 million annual SR&ED expenditure limit was reduced when taxable income for the previous taxation year is between $400,000 and $600,000.
- The carry-forward period of the tax credit was extended to 20 years.
All these measures encouraged new businesses to claim SR&ED.
Data Trends in SR&ED Expenditures and ITC for Refundable Original Claims

Why don’t the trends in ITCs and expenditures match exactly? Aren’t they directly proportional?
SR&ED expenditures incurred are accumulated in a pool of deductible SR&ED expenditures. Any contract payments or government/non-government assistance are deducted from this pool, thereby reducing qualified SR&ED expenditures. The tax credit is then calculated based on the total qualified SR&ED expenditures for investment tax credit purposes.
Comments are closed.